Total Precipitation Increase
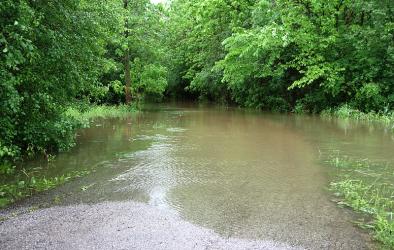
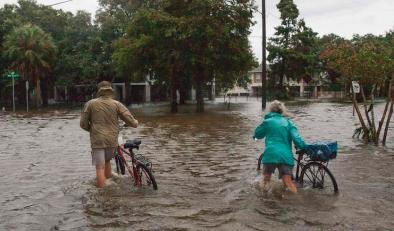
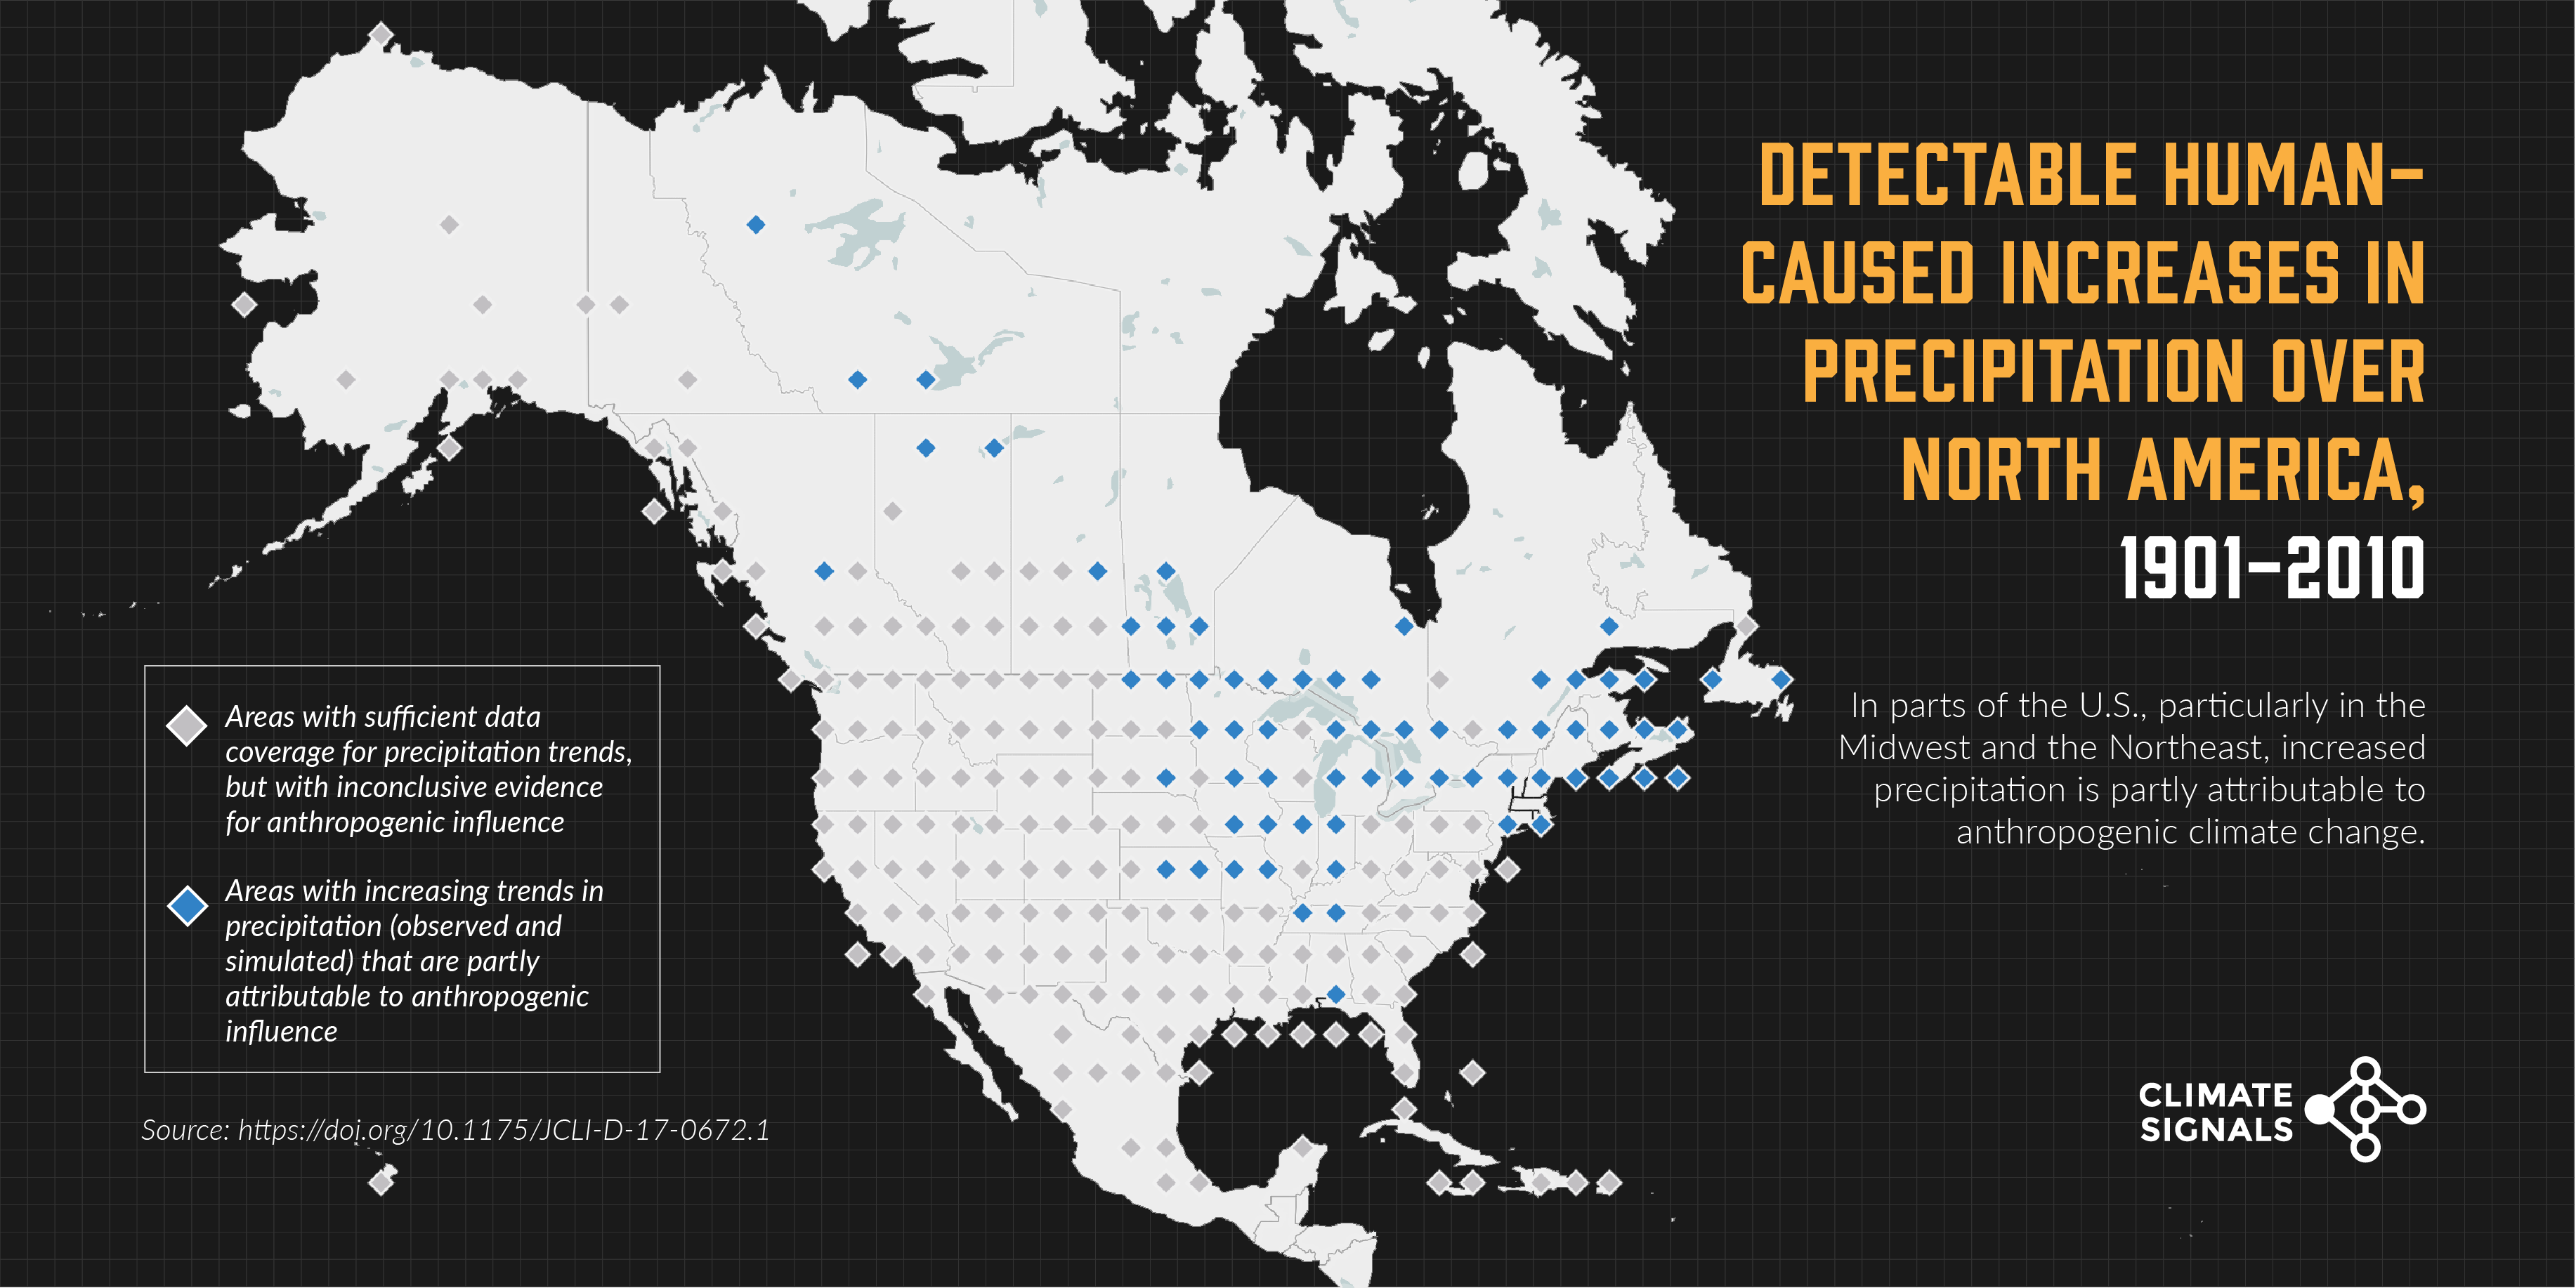
While heavy precipitation events in most parts of the United States have increased in both intensity and frequency, there are important regional and seasonal differences in total precipitation change. Climate change is linked to increased total precipitation and flood risk in the US Midwest and Northeast.
Read MoreAug 25, 2021 | The Washington Post
Tennessee floods show a pressing climate danger across America: ‘Walls of water’

Dec 19, 2019 | Superior Telegram
2019 is the wettest year ever recorded for Wisconsin, Midwest

Aug 8, 2019 | Weather Underground
U.S. Racks Up Wettest Calendar Year to Date by Bob Henson

Jan 28, 2020 | Journal of Climate
The Atmospheric Energy Constraint on Global-Mean Precipitation Change
Dec 18, 2019 | Bulletin of the American Meteorological Society
EEE 2018: Anthropogenic Impacts on the Exceptional Precipitation of 2018 in the Mid-Atlantic
Dec 10, 2019 | Bulletin of the American Meteorological Society
EEE 2018: Anthropogenic Impacts on the Exceptional Precipitation of 2018 in the Mid-Atlantic United States
Climate science at a glance
-
The 12 months spanning July 2018 through June 2019 were the wettest year-long period in the United States in records dating back to 1895.
-
Climate change has increased the likelihood of wet years across the US.[1][2]
-
In the Midwest, significant increases in flooding are well-documented, and the change is likely due to increases in total precipitation linked to climate change.
US total precipitation trends and climate change
- In the Northeast, increases in total precipitation are expected during the winter and spring but with little change in the summer.[3]
- In the Southern Great Plains, total precipitation decreased over the past 30 years.[3] An increase in extreme precipitation, however, has led to an increase in record-breaking flooding over this same period of time.[3]
US studies attribute changes in total precipitation to climate change
- (Knutson and Zeng 2018): Climate change has increased the amount of annual precipitation in the Midwest.
- (Diffenbaugh et al. 2017): Climate change has increased the likelihood of wet years over the US.
- (Knutson et al. 2014): Extreme seasonal and annual mean precipitation during 2013 in the north-central and eastern US were due in part to human-caused climate change.
Global total precipitation trends and climate change
- Climate models robustly predict an increase in global-mean precipitation in response to CO2 doubling. They agree that the magnitude of this increase will be less than the increase of water vapor concentrations.[4]
Global studies attribute changes in total precipitation to climate change
- (Wan et al. 2014): Increases in high latitude precipitation has showed an increase in various datasets, and this is due in part to human caused climate change.
- (Sarojini et al. 2012): Human-caused climate change has likely increased total precipitation across the globe, with the largest effect in high-latitude regions.
- (Zhang et al. 2007): Models detect the effect of anthropogenic climate change on average precipitation across latitudinal bands.
Earth Systems Signals
Global warming is causing widespread and rapid changes in the atmosphere, ocean, cryosphere and biosphere.
Heat Signals
The Earth is getting hotter due to human activities that release heat-trapping gases into the atmosphere.
Drought Signals
Climate change is making droughts more likely to occur, and more severe when they do.
Wildfires Signals
Climate change is increasing the size, frequency, intensity and seasonality of wildfires.
Hurricanes Signals
Warmer temperatures increase the rate of water evaporation, which feeds moisture and energy into storms.
Floods Signals
Worsening floods due to climate change are putting a growing number of communities at risk.


