
Greenhouse Gas Emissions
Human activities, primarily burning fossil fuels and deforestation, load the atmosphere with carbon dioxide (CO2) and other greenhouse gas pollution. The concentration of greenhouse gases in the atmosphere is now greater than at any other time in human history. Multiple lines of evidence show that CO2 levels are driving global warming.
Read More

Climate science at a glance
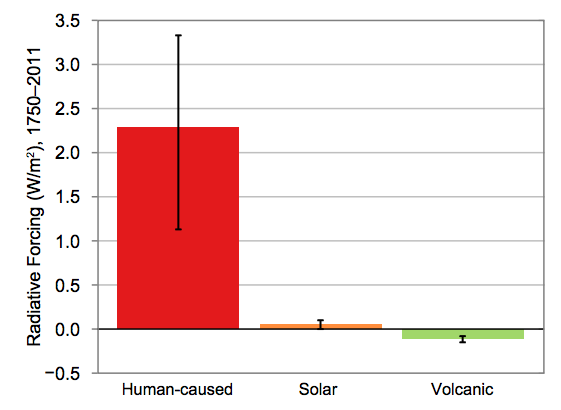 Human activities, primarily burning fossil fuels and deforestation, load the atmosphere with CO2 and other greenhouse gases.
Multiple lines of evidence show that atmospheric levels of CO2 (the main greenhouse gas) are the highest in millions of years and are driving global warming.
Greenhouse gases absorb and trap heat close to the Earth’s surface. They essentially act like a blanket around the planet.
Once trapped in the atmosphere, CO2 pollution is essentially permanent on human timescales. As a result, the warming is also permanent unless the CO2 pollution is pulled back out of the atmosphere. Temperatures will otherwise continue to increase until there is zero CO2 pollution.
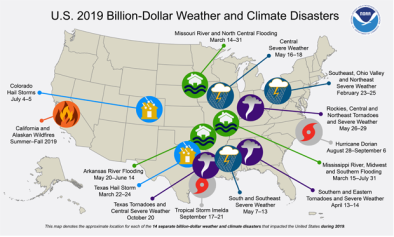
Global warming has already caused higher air and ocean temperatures, rising sea levels, changing seasons and an increase in the frequency and intensity of some extreme weather events like heat waves and heavy rainstorms.
US greenhouse gas emissions trends
- The distribution of observed atmospheric CO2 increases with latitude clearly shows that the increases are driven by anthropogenic emissions that occur primarily in the industrialized countries north of the equator.[1]
Global greenhouse gas emissions trends
Anthropogenic greenhouse gas emissions have increased since the pre-industrial era, driven largely by economic and population growth, and are now higher than ever.
- Intergovernmental Panel on Climate Change, Fifth Assessment Report, Working Group I[1]
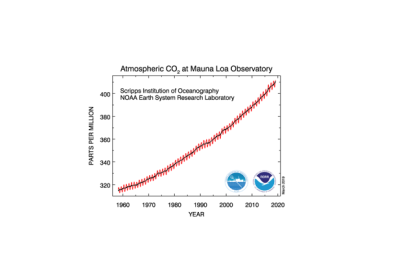
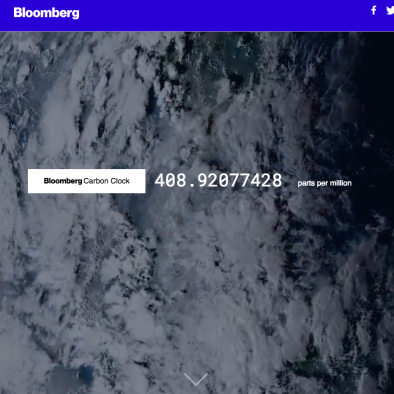
- The global atmospheric carbon dioxide (CO2 ) concentration has now passed 400 parts per million (ppm), a level that last occurred about 3 million years ago, when both global average temperature and sea level were significantly higher than today.[2]
- Between 1750 and 2011, CO2 emissions from fossil fuel combustion and cement production are estimated from energy and fuel use statistics to have released 375 petagrams of carbon (PgC).[1] One petagram is equal to one trillion kilograms (2.2 trillion pounds).
- In 2002–2011, average fossil fuel and cement manufacturing emissions were 8.3 petagrams of carbon per year, with an average growth rate of 3.2 percent per year.[1]
- Between 1750 and 2011, land use change (mainly deforestation) released about 180 PgC.[1] Land use change emissions between 2002 and 2011 are estimated at 0.9 PgC per year.[1]
- Of the 555 PgC released to the atmosphere from fossil fuel and land use emissions from 1750 to 2011, 240 PgC accumulated in the atmosphere. This was determined by looking at the observed increase of atmospheric CO2 concentration from 278] parts per million (ppm) in 1750 to 390.5 ppm in 2011.[1]
- Anthropogenic emissions of CH4, methane gas, account for 50 to 65 percent of total emissions.[1]
- In 2014 and 2015, emission growth rates slowed as economic growth became less carbon-intensive. Even if this slowing trend continues, however, it is not yet at a rate that would limit global average temperature change to well below 3.6°F (2°C) above preindustrial levels.[2]
 Global studies attribute global warming to greenhouse gas emissions
- (Gutowski et al. 2008) state that the global warming of the past 50 years is due primarily to human-induced increases in heat-trapping gases.[3]
- (Santer et al. 1996) look at observed spatial patterns of temperature change in the atmosphere from 1963 to 1987 and find the patterns are similar to those predicted by models incorporating human-caused changes in carbon dioxide, anthropogenic sulphate aerosol and stratospheric ozone concentrations.[4]
- (Santer et al. 1995) provide the first evidence that both the global and smaller-scale components of a combined CO2/anthropogenic sulfate aerosol signal are identifiable in the observed near-surface air temperature data.[5]


