Science Source
Climate change, extreme events and increased risk of salmonellosis in Maryland, USA: Evidence for coastal vulnerability
- Uses daily weather data from the National Climatic Data Center website for the 1960–2012 period, including daily maximum temperature (TMAX) and precipitation (PRCP)
- Computes county-specific 30 year baselines for a given calendar day using a 31 day window that centered around the particular calendar day
- Identifies the 90th and 95th percentile values of PRCP and TMAX, referred to as Extreme Precipitation Threshold 90th percentile (EPT90) and Extreme Temperature Threshold 95th percentile (ETT95)
- Compares calendar day specific PRCP and TMAX values for each county; assigns a value of “1” if they exceeded the thresholds, and “0” otherwise; and sums these “exceedance days” over the calendar month for each county during the 2002–2012 period
- Investigates the relationship between EPT90 and ETT95 exceedance events and salmonellosis risk in all 24 Maryland counties for the 2002–2012 period
- Finds the annual incidence of salmonellosis for Maryland ranged from 12.7 per 100,000 population in 2006 to 17.7 per 100,000 population in 2010
- Observes a higher incidence of salmonellosis during Summer months followed by Fall, while the lowest incidence was observed during the Winter months
- Observes a 4.1% increase in the risk of salmonellosis associated with a 1 unit increase in ETT95 exceedance (incidence rate ratio (IRR) 1.041; 95% confidence interval (CI): 1.013–1.069)
- The findings related to extreme precipitation events were more consistent compared with those related to extreme temperature events
- Observes a 5.6% increase in the risk of salmonellosis associated with a 1 unit increase in EPT90 exceedance (IRR 1.056; 95% CI: 1.035–1.078), but the increase in risk was not equal across all areas
- Finds a one unit increase in EPT90 exceedance was associated with a 7.1% increase in the risk of salmonellosis in coastal counties (IRR 1.071; 95% CI: 1.044–1.099) compared wtih a 3.6% increase in non-coastal counties (IRR 1.036 95% CI: 1.017–1.054)
Related Content
Headline

Aug 5, 2016 | CBS Baltimore
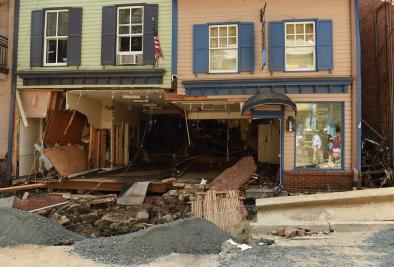
Slow Progress In Ellicott City, Days After Historic Flooding
Headline

Aug 4, 2016 | Baltimore Sun
Ellicott City residents briefly allowed back into homes
Headline

Aug 3, 2016 | Phys.org
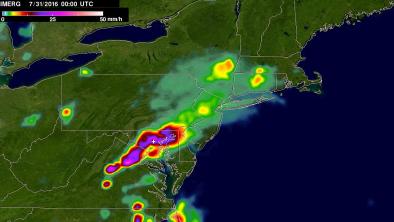
NASA looks at historic flooding from slow-moving Maryland storms
Headline

Aug 3, 2016 | Grist
Rain bombs? From heat domes to rain bombs, climate change is changing how we talk about weather


