Science Source
Geographically heterogeneous temporal trends of extreme precipitation in Wisconsin, USA during 1950–2006
- Examines temporal and spatial patterns of extreme precipitation in Wisconsin during 1950–2006
- Uses daily precipitation data created by researchers at the University of Wisconsin-Madison using spatial interpolation of weather stations data across the state to a grid mesh with a spatial resolution of 8 km
- Calculates—for extreme precipitation indices—the 99th, 95th, 90th, 85th, and 80th percentiles of daily total precipitation (>1 mm) in a year and the number of days per year with daily precipitation exceeding 10 mm, 20 mm, and 50 mm
- Conducts the Mann–Kendall test for trend, examined how geographical heterogeneity varied over time, and built quantile regression models for annual summer precipitation
- Finds the temporal trend of extreme precipitation varied widely across the state
- Finds the highest percentile index showed an increasing trend over the largest area, whereas indices of less extreme precipitation tended to generally decrease
- Finds extreme precipitation tended to show more dispersed and skewed spatial patterns than annual total precipitation
- Finds, overall, that indices related to frequency showed more similar spatial and temporal trends to total precipitation than magnitude indices
Related Content
Headline

Jul 14, 2016 | Associated Press
Third Death Confirmed in Wisconsin Floods, Officials Say
Headline

Jul 14, 2016 | Mental Floss
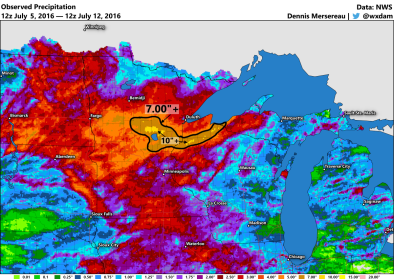
Incredible Deluge Floods Minnesota and Wisconsin
Science Source
| Journal of Hydrologic Engineering
Assessing the Effects of Climate Change on Precipitation and Flood Damage in Wisconsin
Schuster, Z., Potter et al
Headline

Jul 13, 2016 | Duluth News Tribune
Flooding causes major damage at Saxon Harbor; one fatality reported


