An intense Greenland melt season: 2012 in review

Greenland’s surface melting in 2012 was intense, far in excess of any earlier year in the satellite record since 1979. In July 2012, a very unusual weather event occurred. For a few days, 97% of the entire ice sheet indicated surface melting...
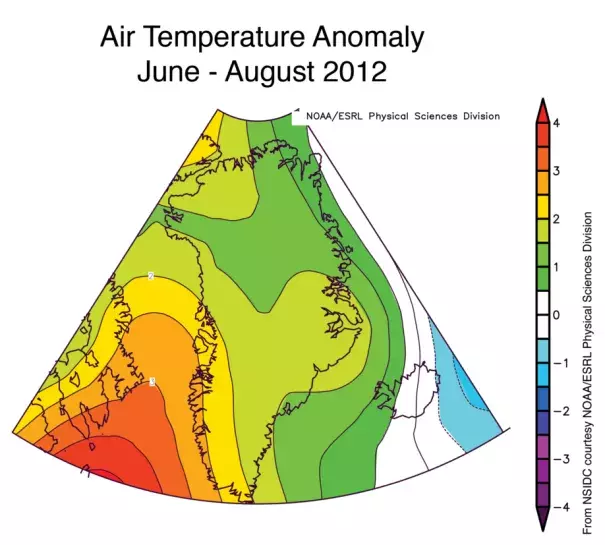
Warm conditions in 2012 were caused by a persistent high pressure pattern that lasted much of the summer. Since September, temperatures have remained warmer than average, but dropped well below freezing as autumn and winter arrived...
Overall, melt extent was the largest in the satellite record since 1979, and melting lasted almost two months longer than average. This was the first year in the satellite record that the entire ice sheet experienced melt at some point in the season...
During a peak melt event in July, even the summit areas of the ice sheet, nearly two miles above sea level, saw snowmelt conditions. While this has been observed in ice cores a handful of times in the past 1,000 years, it had not previously occurred in this century
Related Content


