Science Source
The relative increase of record high maximum temperatures compared to record low minimum temperatures in the U.S.
- States the current observed value of the ratio of daily record high maximum temperatures to record low minimum temperatures averaged across the U.S. is about two to one
- States this is because records that were declining uniformly earlier in the 20th century following a decay proportional to 1/n (n being the number of years since the beginning of record keeping) have been declining less slowly for record highs than record lows since the late 1970s
- Finds that model simulations of U.S. 20th century climate show a greater ratio of about four to one due to more uniform warming across the U.S. than in observations
- Finds that following an A1B emission scenario for the 21st century, the U.S. ratio of record high maximum to record low minimum temperatures is projected to continue to increase, with ratios of about 20 to 1 by mid-century, and roughly 50 to 1 by the end of the century
Related Content
Headline

Sep 5, 2017 | Orange County Register
How Hurricane Harvey is tied to the California heat wave
Headline

Sep 5, 2017 | The Weather Channel
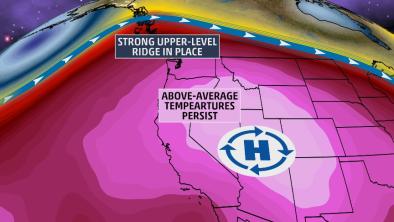
All-Time Record-High Temperature Set in San Francisco; Record Heat Shifts to the Northwest This Week
Headline

Sep 5, 2017 | Los Angeles Times
More all-time heat records broken as California broils
Headline

Sep 5, 2017 | Category 6 | Weather Underground
Heat, Smoke, and Fire Assault Western States: All-Time Record Heat in California


