A warm approach to the equinox
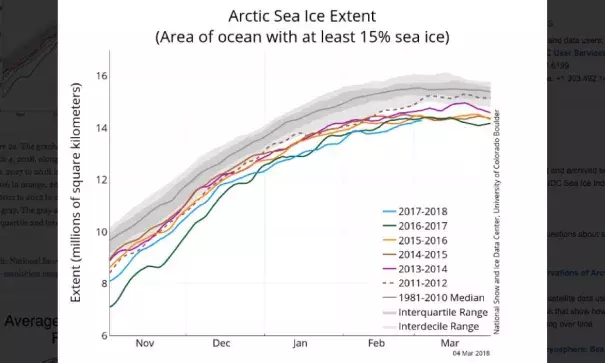
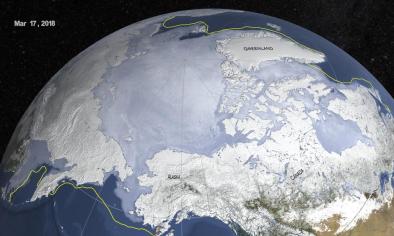
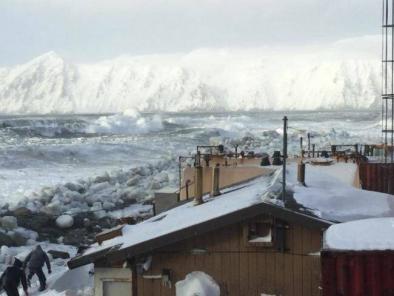
As temperatures at the North Pole approached the melting point at the end of February, Arctic sea ice extent tracked at record low levels for this time of year. Extent was low on both the Atlantic and Pacific sides of the Arctic, with open water areas expanding rapidly in the Bering Sea during the latter half of the month. On the other side of the globe, Antarctic sea ice has reached its minimum extent for the year, the second lowest in the satellite record.
Overview of conditions
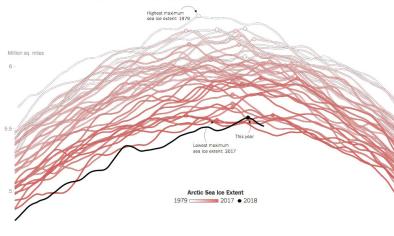
Winter continues to be mild over the Arctic Ocean. Sea ice extent remained at record low daily levels for the month. Arctic sea ice extent for February 2018 averaged 13.95 million square kilometers (5.39 million square miles). This is the lowest monthly average recorded for February, 1.35 million square kilometers (521,000 square miles) below the 1981 to 2010 average and 160,000 square kilometers (62,000) below the previous record low monthly average in 2017.
...
February 2018 compared to previous years
The linear rate of decline for February is 47,000 square kilometers per year (18,000 square miles per year), or 3.1 percent per decade.
Late freeze-up
This year, the freeze-up started earlier than average over much of the central Arctic Ocean, near average within Hudson and Baffin Bays, but significantly later than average elsewhere. Freeze-up was delayed by more than a month later than average within the Chukchi and Bering Seas on the Pacific side, and within the Barents and East Greenland Seas on the Atlantic side. In these regions freeze-up happened after December. Later freeze-up impacts sea ice thickness, reducing the number of days over which sea ice can grow during winter.
...
Opposite pole, same near-record low extent
In the Antarctic, sea ice extent reached its daily seasonal minimum, 2.18 million square kilometers (842,000 square miles), on February 20 and 21. This is the second lowest minimum extent in the satellite record, 70,000 square kilometers (27,000 square miles) above the record low, which was set on March 3, 2017. The February average was 2.29 million square kilometers (884,000 square miles), second lowest in the satellite record, and 20,000 square kilometers (7,700 square miles) above the record low February in 2017.
Sea ice in the Antarctic is highly variable from year to year—much more so than in the Arctic. This is clearly seen in the February extent values, where low 2011 values were followed by record or near-record highs in 2013, 2014, and 2015. This was then followed by record or near-record lows in 2017 and this year.
Related Content
