Unusually Early Greenland Melt

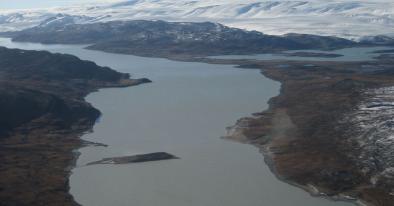
An early melt event over the Greenland ice sheet occurred this week, smashing by a month the previous records of more than 10% of the ice sheet melting.
Based on observation-initialized weather model runs by DMI, almost 12% of the Greenland ice sheet had more than 1mm of melt on Monday 11th April, following an early start to melting the previous day. Scientists at DMI were at first incredulous due to the early date. “We had to check that our models were still working properly” said Peter Langen, a climate scientist at DMI...
The former top 3 earliest dates for a melt area larger than 10% were previously all in May (5th May 2010, 8th May 1990, 8th May 2006)...
The melt was driven by warm air advected from the SW bringing rain along the coast, similar to an extreme melt event in 2012 when 95% of the surface of the ice sheet had melt, a situation that has been reported in detail by GEUS and DMI scientists
Related Content


