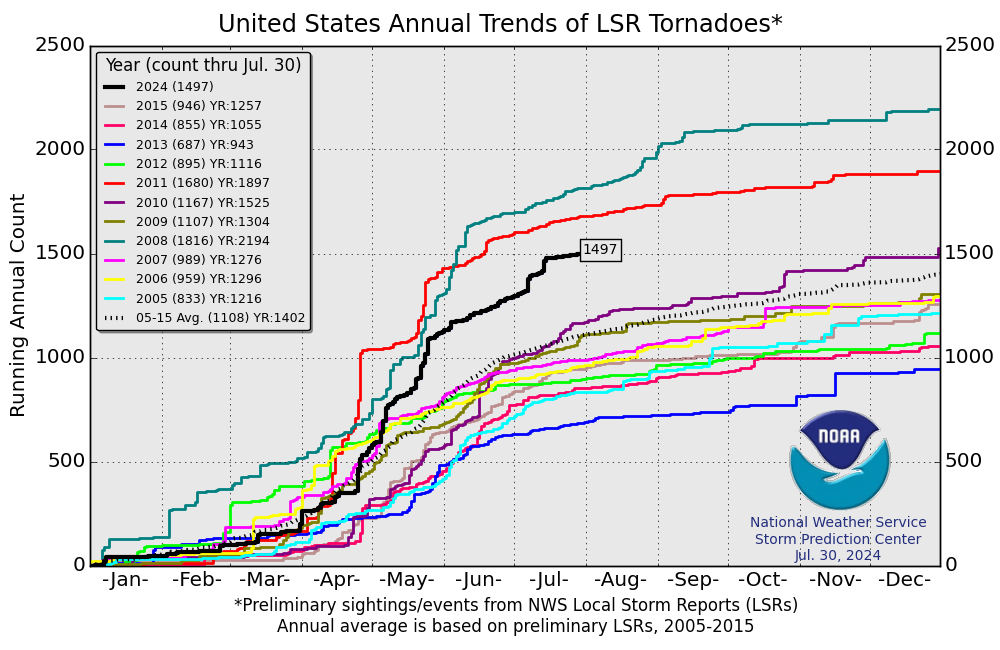
US Annual Tornado Count
NOAA Storm Prediction Center
Local Storm Reports

Inflation adjusted annual tornado running total

"Inflation-adjusted” cumulative tornado totals for the period since 1954 (various colors) and the current year to date (black). The red trace shows the highest adjusted value observed on each date through the year, with the lowest value on each date in magenta.
Related Content
Headline

May 17, 2017 | Inside Climate News
Extreme weather flooding the Midwest looks a lot like climate change
Headline

May 16, 2017 | E&E News
Trump country is flooding, and climate ideas are shifting
Headline

May 15, 2017 | Southeast Missourian
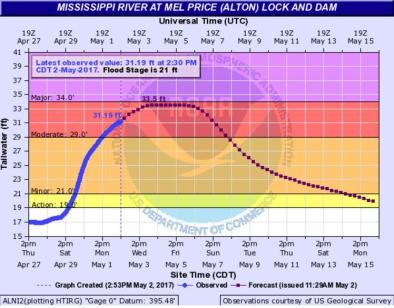
Red Star residents brace for floods; farm fields flooded in Alexander County
Headline

May 15, 2017 | WVIK
Cities Downstream Brace for Major Flooding


